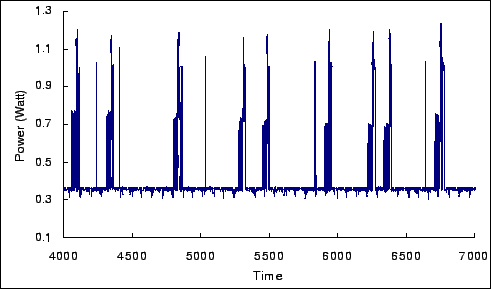
In Fig. 1, there are power valleys separated by nine major power peaks, which correspond to software responses to user tapping of GUI buttons. In the power valleys, the system waits for user input while the Linux kernel does maintenance jobs like handling timer interrupts and scheduling, which introduces small fluctuations and several minor spikes in the valley. Such power characteristics are typical of most interactive software usage.
To see how much time and energy the valleys take, we analyzed
usage traces for two users of four commercial applications shipped
with the PDA, as detailed in Section VII. The
percentage of total time and energy the PDA spent waiting for user
input is shown in Table 1. Clearly, over
90% of the time and energy was spent in waiting for user input.
Moreover, most of the waiting periods are longer than 500ms. This
demonstrates the vast opportunities available for power
optimization of such interactive systems.
| Benchmarks | User | Total time (s) | Time(%) | Energy(%) |
| Calculator | 1 | 39.2 | 99.4 | 98.5 |
| 2 | 17.4 | 99.8 | 97.8 | |
| Filebrowser | 1 | 187.5 | 99.1 | 97.6 |
| 2 | 106.3 | 98.7 | 96.4 | |
| Go | 1 | 1,214.9 | 97.9 | 94.2 |
| 2 | 258.9 | 94.6 | 90.2 | |
| Solitaire | 1 | 734.3 | 99.8 | 99.6 |
| 2 | 397.2 | 99.1 | 97.4 |