


Next: Spurious switching activity (SSA)
Up: Observations
Previous: Observations
We evaluated eight high-level synthesis benchmarks implemented in
0.18 m technology. Chemical and IIR77 are
IIR filters used in the industry. DCT_IJPEG is the
Independent JPEG Group's implementation of digital cosine
transform (DCT) [39]. DCT_Wang is the DCT
algorithm named after the inventor [40]. Both DCT algorithms
work on
m technology. Chemical and IIR77 are
IIR filters used in the industry. DCT_IJPEG is the
Independent JPEG Group's implementation of digital cosine
transform (DCT) [39]. DCT_Wang is the DCT
algorithm named after the inventor [40]. Both DCT algorithms
work on  pixels. Elliptic, an elliptic wave
filter, and Diffeq, a differential equation solver, are
from the NCSU CBL high-level synthesis benchmark
suite [41]. Jacobi is the Jacobi iterative
algorithm for solving a fourth order linear
system [42]. WDF is an FIR wave digital
filter. Table I gives the number of basic operations
in the benchmark behaviors. It also indicates whether there are
loops inside the behavior. The smallest benchmark is
Diffeq with six multiplications, two additions and two
subtractions. The largest is Jacobi with 24
multiplications, eight divisions, eight additions and 16
subtractions.
pixels. Elliptic, an elliptic wave
filter, and Diffeq, a differential equation solver, are
from the NCSU CBL high-level synthesis benchmark
suite [41]. Jacobi is the Jacobi iterative
algorithm for solving a fourth order linear
system [42]. WDF is an FIR wave digital
filter. Table I gives the number of basic operations
in the benchmark behaviors. It also indicates whether there are
loops inside the behavior. The smallest benchmark is
Diffeq with six multiplications, two additions and two
subtractions. The largest is Jacobi with 24
multiplications, eight divisions, eight additions and 16
subtractions.
Table I:
Information on benchmark behaviors.
|
Chemical |
DCT_IJPEG |
DCT_Wang
|
Diffeq |
Elliptic |
IIR77
|
Jacobi |
WDF |
|---|
No. of  |
17 |
12 |
21 |
6 |
0 |
22 |
24 |
8 |
No. of  |
0 |
0 |
0 |
0 |
0 |
0 |
8 |
0 |
No. of  |
9 |
24 |
14 |
2 |
26 |
14 |
8 |
26 |
No. of  |
6 |
12 |
12 |
2 |
0 |
0 |
16 |
0 |
|
Loop(Y/N) |
Y |
N |
N |
Y |
Y |
Y |
N |
Y |
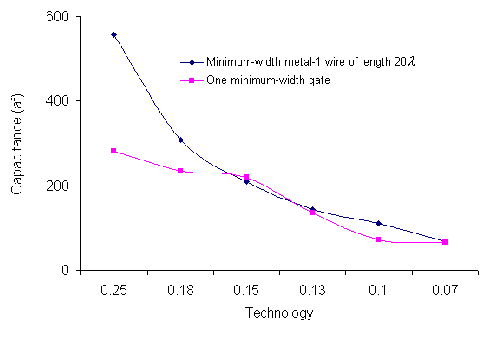
Using wire and gate capacitances data from [43],
Fig. 1 shows the input capacitance of a
minimum-width gate along with the capacitance (as the sum of area,
fringing and coupling capacitance) of a minimum-width metal-1 wire
of length of 20 (where is the minimum feature
size) for different DSM technologies. The figure shows that the
two are comparable for current and future technologies. In a
circuit, a data transfer wire between datapath units can be
hundreds of long, which is equivalent to tens of gates
in terms of input capacitance. Its power consumption is thus
non-negligible.
(where is the minimum feature
size) for different DSM technologies. The figure shows that the
two are comparable for current and future technologies. In a
circuit, a data transfer wire between datapath units can be
hundreds of long, which is equivalent to tens of gates
in terms of input capacitance. Its power consumption is thus
non-negligible.
Figure 1:
Wire
vs. gate capacitance.
 |
We used the wire capacitances from the same source along with an
RTL design library from NEC [44,45] to
estimate power consumption for the benchmarks. The NEC RTL library
was characterized for power and area through logic-level power and
area estimation, which was verified to be within 10% of SPICE
simulation. Fig. 2 shows the
percentage of total power consumed by RTL interconnects for
area-optimized (AO) and interconnect-unaware power-optimized
(IUPO) benchmarks, respectively.
Figure 2:
Percentage of total power consumed by interconnects in
area-optimized and power-optimized circuits.
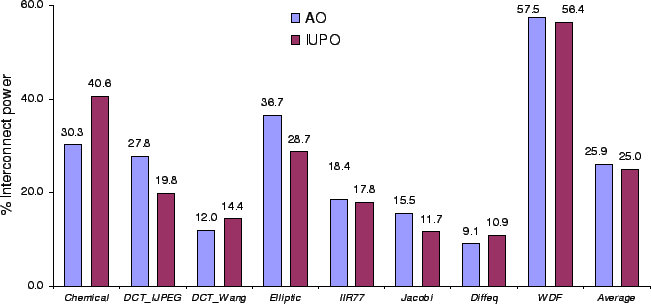 |
In both AO and IUPO circuits, interconnects consume a significant
percentage of total power, with the average percentage being
25.9% and 25.0%, respectively. It is worth noting that if the
coupling effect is not considered, the interconnect power
percentage will be 16.2% and 14.3%, respectively.
Next: Spurious switching activity (SSA)
Up: Observations
Previous: Observations
Lin Zhong
2003-10-11